Map
Where the readings come from. The shaded circle is the general area, not the station boundary.
The map is tilted to show the hills. Right-click and drag, or twist with two fingers, to turn it; the compass button sets it back. Hillside shading and 3D terrain come from open elevation tiles; on the published site the base is LINZ aerial imagery and elevation (LINZ Basemaps, CC BY 4.0).
River gauge 71103
Hakataramea River upstream of the SH82 bridge
No reading
-44.7248, 170.4905
Forecast point
Open-Meteo model point on the valley floor, used for the rain forecast. It’s a model estimate, not a rain gauge on the farm.
-44.60, 170.60
General area
Lower Hakataramea Valley, near Kurow. Paddocks and boundaries are not shown in this public view.
The valley in 3D
The lower Hakataramea Valley from LINZ LiDAR, heights stretched 1.6 times. Contours every 50 m. The streaks on the river move faster when more water is going past the gauge; with no reading the river is drawn still.
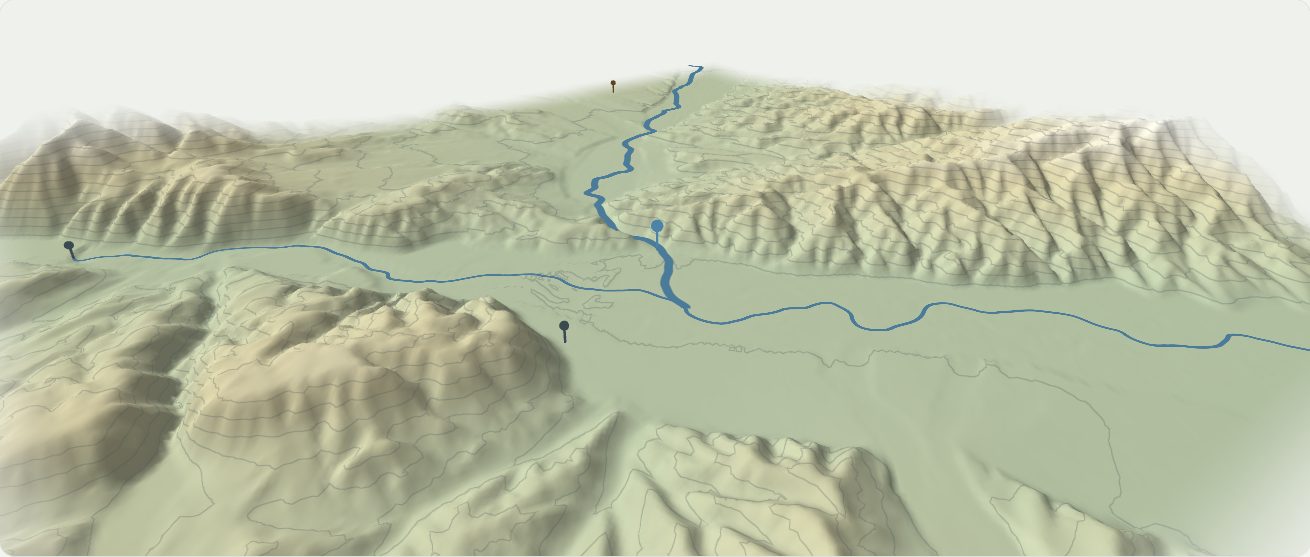
Elevation: LINZ, Canterbury LiDAR 1 m DEM (2020-2023) and NZ 8 m DEM, CC BY 4.0. The cards above link each reading to its record.